Celebrate the Facts!
|
|
|
For every dollar a billionaire donates to charity, taxpayers chip in anywhere from 37 to 57 cents in the form of lost tax revenue, depending on the status of the donor’s tax avoidance strategies. Taxpayers effectively provide matching funds for the donation priorities of private donors. In 2018 charitable dollars went to religion (29%), education (14%), human services (12%), grant-making foundations (12%), and health (9%). Representative examples of billionaire philanthropy:
A popular new trend for the wealthy is the Donor-Advised Fund (DAF). The first DAFs were created in the 1930s, though regulatory recognition did not exist until the Tax Reform Act of 1969. In the 1990s, DAFs began to grow in popularity: DAFs held $121.42 billion in assets by 2018. Annual contributions to DAFs were $37 billion in 2018. Those contributions resulted in tax avoidance of between $14 billion and $21 billion that otherwise would have been contributed to the US Treasury. A DAF allows donors to make a charitable contribution, receive an immediate tax deduction, and then request grants from the fund with no requirement about rates of disbursement – in other words, this money can be parked or hoarded indefinitely or used for essentially any non-political purpose (the money is not revocable and must be disbursed to a 501(c)(3) organization). On its website, the IRS claims it is aware some organizations have appeared to abuse the basic concepts underlying DAFs. According to this narrative, these organizations appear to have been established to generate questionable charitable deductions and provide illegal benefits to donors and their families (including tax-sheltered investment income for the donors) and management fees for promoters. This warning might just be that – an Internet search shows no imposition of excise taxes for enforcement. Under the Internal Revenue Code, all section 501(c)(3) organizations are prohibited from directly or indirectly participating in, or intervening in, any political campaign on behalf of (or in opposition to) any candidate for elective public office. Voter education activities (including presenting public forums and publishing voter education guides) conducted in a non-partisan manner do not constitute prohibited political campaign activity. The 20 richest Americans donated roughly $8.7 billion to charity in 2018, just 0.8 percent of their collective net worth. In 2018, Warren Buffett's net worth stood at $88 billion and he was the largest contributor to charity. Buffett gave away $3.4 billion which was about 3.9% of his fortune, however, if one includes the tax credit value of 37% (conservative) the net effective value was $2.5 billion or 2.8% of his net worth. Excluding Gates and Buffett -- the two top givers -- that plummets to $2.8 billion, or 0.3 percent of their total net worth. Those charity donations resulted in effective tax credits of a conservatively estimated $3.2 billion tax savings for those 20 richest billionaires – meaning the effective donation was only $5.5 billion.
By 2018 the top 1% in the United States had accumulated a net worth of about $32 trillion while the bottom 50% had accumulated a net worth of only $1.3 trillion – a 25:1 ratio. In 1989 the top 1% possessed $1.9 trillion in wealth as opposed to the bottom 50% had $0.8 trillion (a 2.4:1 ratio). This concentration of wealth and disparity of wealth is a topic for a different investigation but as an aside, this disparity appears to be unsustainable. Right or wrong or deserve has nothing to do with it – historically, societies with that level of disparity have revolutions and resultant corrections: a topic for a later investigation. There are large questions posed by this investigation. The reduction in marginal tax rates starting in the early 1980s is correlated with a concentration of wealth. The tax code provides incentives to donations to charities in the form of deductions effectively making the taxpayer a co-funder of billionaire philanthropic activities but with no voice in the disbursement of these funds (aside from the explicit prohibition on political activity). This tax policy should be examined and discussed and is of bipartisan concern.
Data on tax deduction values acquired from The Nation (https://www.thenation.com/article/archive/philanthropy-charity-inequality-taxes). Information on charitable contribution percentages and representative projects was provided by the National Philanthropic Trust (https://www.nptrust.org/philanthropic-resources/charitable-giving-statistics/). Internal Revenue Service Information was provided by the Internal Revenue Service (www.irs.gov). Information on charitable contributions by the top-20 billionaires was provided by Fox Business (https://www.foxbusiness.com/money/how-much-do-billionaires-donate-to-charity). Statistics and the table on wealth concentration were provided by the United States Federal Reserve (https://www.federalreserve.gov/).
0 Comments
The US spends more on defense than the next 10 countries combined. Depending on the definition of a military base there are between 400 and 800 US military bases in 150 foreign countries – there are 200 countries in the world. By any definition, the United States is an empire. The US military presence is intended not only for defense – to fence in Russia and China - but also to secure supply lines and markets and support friendly governments. Highlights of the 2020 budget include:
Military spending makes up about 16% of entire federal spending and about half of discretionary spending. This commitment was 3.2% of the Gross Domestic Product (GDP) in 2018 which is consistent with historic rates – levels of expenditures generally rise under Republican Administrations and stay level during Democratic but are still enormous. This percentage does not include military-related non-Department of Defense spending, such as Veterans Affairs, Homeland Security, interest paid on debt incurred in past wars, or qualitative social costs such as physical and psychological disabilities of veterans. US defense spending has increased markedly during the Trump Administration – an increase of about 15% in the 2020 budget compared to the 2016 budget. Regardless of tribal media spin, 85 US Senators voted for those increases so there was bipartisan agreement and largely has been. By contrast, the Russian Federation’s 2018 expenditures were only about 9.5% that of the US, about 3.9% of a rather small economy (the 10th largest in the world). Despite the huge disparity in investment, the Russian Federation has done quite well since 2014 and has remained internationally relevant using a combination of opportunistic projection of traditional power and asymmetric warfare strategies:
China has a significant military but devotes a smaller percentage of GDP – 1.9% in 2018 - of a smaller economy and has also utilized low-cost high-value strategies to enhance their position:
  Perhaps the Russians and Chinese have succeeded simply because they were compelled to due to limited resources. Their new asymmetric strategies are not muddled by troublesome election cycles – both have autocratic leaders who will likely be in power for decades and each has a strategic vision. Achieving those goals by increments in accord with a long-term strategy, chipping away, corroding established relations, inching into new territory and markets, sometimes at a seemingly glacial pace, but effective over horizons envisioned as decades.
Due to higher debt service on immense deficits accrued through tax cuts and coronavirus-related costs, the next budget debates will center on reductions of costs, and the defense budget will get a great deal of scrutiny, regardless of the bipartisan acclamation of the huge recent budget increases. Still, at 3.2% of GDP (2018), the costs are in line with historical values. Cyberwarfare techniques have the possibility of starting and winning a war without firing a shot pose a huge threat, shutting down the ability to communicate with planes and ships, shutting down utilities, Internet communication, financial markets, and other vital resources. Perhaps the bigger discussion should be about how we spend our money – more expensive and perhaps outmoded weapons and planes or more intelligent expenditures:
The reference for the number of US military bases was derived from an article in The Nation (https://www.thenation.com/article/archive/the-united-states-probably-has-more-foreign-military-bases-than-any-other-people-nation-or-empire-in-history). Data on military expenditures was sourced from the Stockholm International Peace Research Institute (https://www.sipri.org/databases/milex) and the Peter G. Peterson Foundation (https://www.pgpf.org/chart-archive/0053_defense-comparison). Data on current US defense expenditures were collected from the US Defense Department (https://www.defense.gov/Newsroom/Releases/Release/Article/2079489/dod-releases-fiscal-year-2021-budget-proposal). Information on Chinese industrial espionage was presented by The National Interest (https://nationalinterest.org/blog/buzz/china-knows-all-about-f-35-and-f-22-thanks-data-it-stole-61912). Information on the Russian Federation presence in Libya was provided by the Center for Strategic & International Studies (https://www.csis.org/analysis/moscows-next-front-russias-expanding-military-footprint-libya). A limited investigation of undergraduate college tuition costs comparing inflation-adjusted in-state tuition costs from 10 geographically distributed flagship universities indicated an average increase of 34 percent from 1998 to 2018. Sources of additional costs may be increased capital investment costs and lower federal funding of public universities likely resulting in lower accessibility for middle-income students, a higher contribution by relatives of students, and higher debt load due to student loans required to make up the difference. Related Facts:
Higher costs for post-secondary education lead to less accessibility and consequent lower educational attainment. Income and social class are directly related to educational attainment. Lower levels of education lead to lower productivity and lower Gross Domestic Product. Elevated levels of debt from college graduates can contribute to various areas of concern – lower consumer purchasing power, a higher level of unhappiness and consequent social unrest, and lower savings due to less disposable income. Would the United States benefit from higher federal government investment? Likely these benefits would be measurable and provide generational positive benefit by countering the corrosive effects of higher college costs. Possible advantages of higher investment:
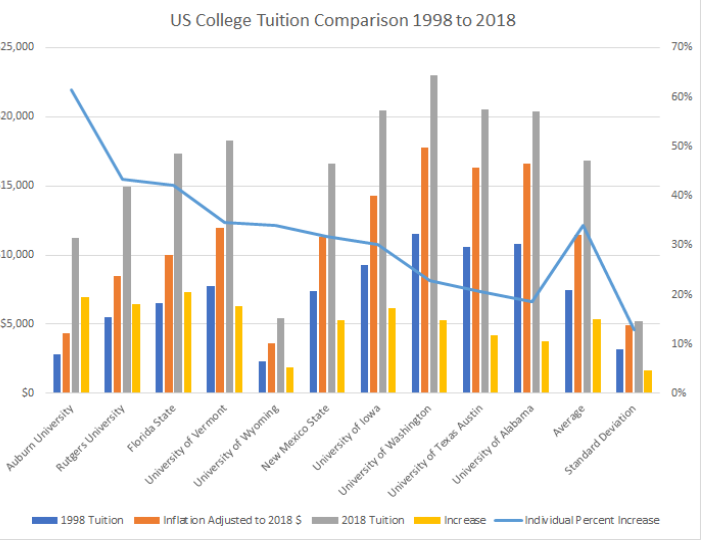 Flagship public universities were included to ensure the sample was comparable – large institutions, publicly-funded, intended to be a destination for the students rather than a second or tertiary choice. In-state tuition was also chosen for comparison. Schools were located throughout the United States.
The widespread use of labor cost lowering strategies such as wide use of adjunct professors would likely lower salary and benefits costs. Lower costs due to technology vs. technology costs were not examined but assumed to cancel one another out. There has been a capital investment boom in United States universities but the effect of this is unknown and out of the scope of this evaluation. Costs were adjusted using an inflation factor of 54.1 percent (https://www.usinflationcalculator.com/) and raw costs from tuition were obtained from the Chronicle of Higher Education (https://www.chronicle.com/interactives/tuition-and-fees). Information on federal funding was obtained from the Pew Trusts (https://www.pewtrusts.org/en/research-and-analysis/issue-briefs/2019/10/two-decades-of-change-in-federal-and-state-higher-education-funding). |
InvestigatorMichael Donnelly investigates societal concerns with an untribal approach - to limit the discussion to the facts derived from primary sources so the reader can make more informed decisions. Archives
July 2023
Categories |

 RSS Feed