Celebrate the Facts!
|
|
|
Expenditures on healthcare consume more of the United States economy than other developed nations with much poorer results. In some cases, results are inversely correlated with costs expended per capita. The why’s of that are complex but remain unexamined by corporate media. This investigation presents the facts and poses questions for later studies. Three cohort countries were selected for comparison:
All are developed nations, have similar medical technologies, have analogous age demographics and occupational exposure to health hazards, and provide comparable delivery systems. The other three countries, as in almost all developed countries, provide economic delivery through socialized medical systems, a factor which is significant in this discussion, among other economic factors. For this investigation health indicators were selected for analysis:
These health indicators are commonly-referenced indices of health for nations. The raw data for this investigation was provided by the World Bank. These indices are a sample, but almost all the significant health indicators show the same trends and relationships as presented in this study. The most recent year data was published was 2017, but other credible primary sources indicate the trendlines only have accentuated since that time.  The United States far outstrips the cohort in percent of Gross Domestic Product devoted to health care – 17% for the United States and an average of 10.7% for the other three, a variance of about 6.7%. In 2000 the United States rate was 12.5% vs an average of the cohort of 7.2%, for a variance of about 5.3%. The United States expenditures as a percent GDP have been increasing over time, but more important is the immense size of the GDP of the United States vs. population. 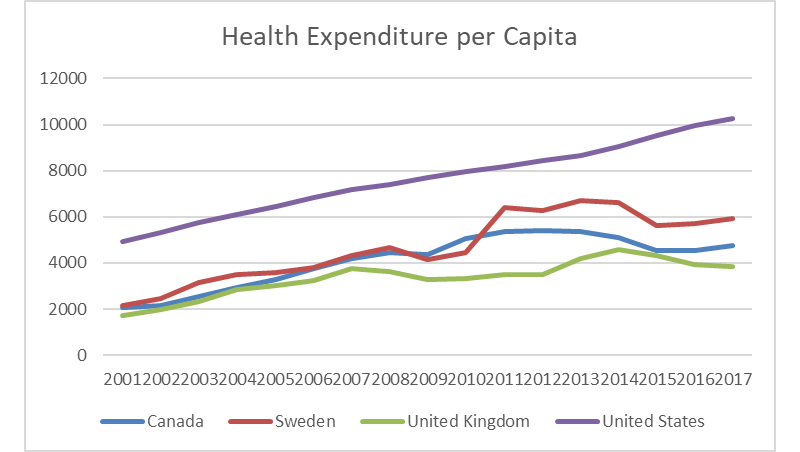 In 2017, the United States spent about $10.2k per capita against an average of $4.8k for the other countries – an astounding comparison. That value has continued to increase in the study period, inflation-adjusted values considered, doubling the United States value of $4.9k in 2000. The cohort countries have also had similar percentage increases – from an average of about $2k in 2000 to the previously referenced $4.9k average in 2017. With this incredible increase in real dollars devoted to medical care, logic would indicate health indicators are improving, and the United States is leading the world in public health. Unfortunately, that is not the case. In all the examined indicators the United States not only trails the rest of the cohort but trails badly. 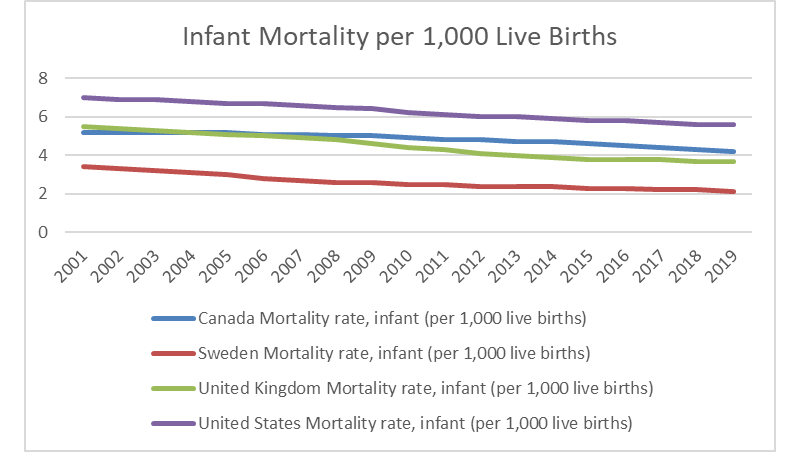 Infant mortality is a common statistic to evaluate public health; it is the number of infant deaths per 1,000 live births. The chart above shows the values by year and while all the countries in the study show a similar rate of decline over time, the United States at 5.6 had about 2.3 infant deaths per 1,000 more than the average of the cohort group at about 3.3. There are other factors in play in this statistic as there are huge disparities in the United States in income, with an incredible amount of the population living in poverty. Low-income results in poor nutrition, less access to medical care, less prenatal medicine, and so results in higher infant mortality. 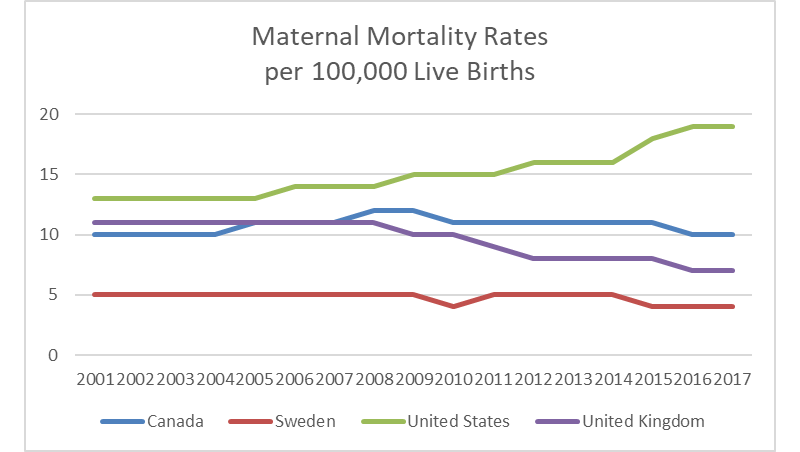 The rate of increase of maternal mortality, the number of women who die per 100,000 live births, is depicted in the above chart. In 2000, that number was 13, but by 2017 it had increased to 19, while the cohort average dropped from 8.7 to 7. The increase is attributable to a complex and interrelated group of economic factors, poor public health management infrastructure, and inefficient delivery of medical care. 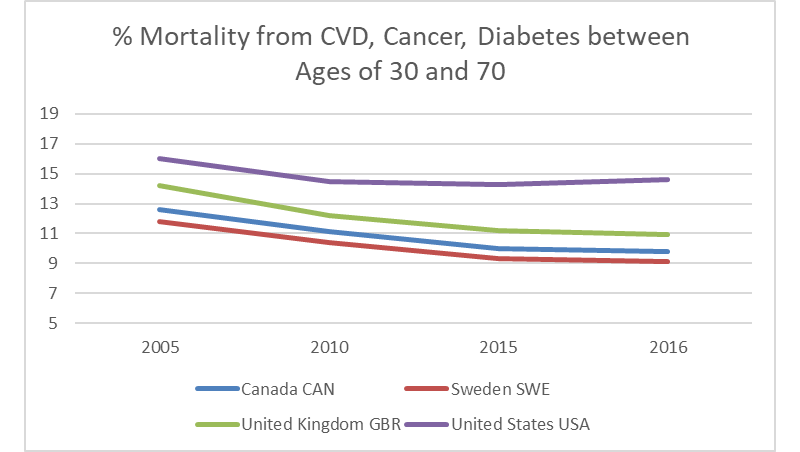 The chart above presents the percent of 30-year-old people who would die before their 70th birthday of cardiovascular disease, cancer, diabetes, or chronic respiratory disease assuming s/he would experience current mortality rates at every age and s/he would not die from any other cause of death (e.g., injuries or HIV/AIDS). A cursory evaluation of the slopes of the curves tell the tale here once again – the United States rate of decline has flattened and compares unfavorably with the cohort. In the United States in 2017, at 12%, that value was 5% higher than the average of the cohort, which was 7%. That variance was about 4.3% in 2000. 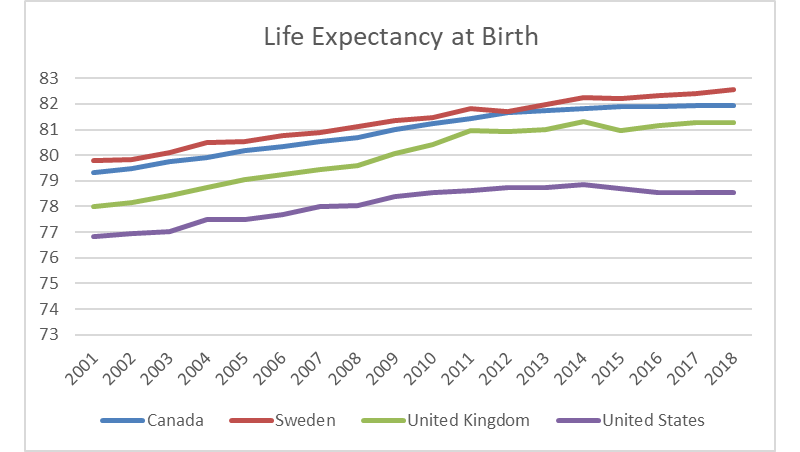 Life expectancy at birth is the average number of years that a newborn is expected to live if current mortality rates continue to apply. The United States trails the cohort. In 2017, the life expectancy of the United States was about 78.5 for all sexes compared to the average of the cohort at almost 82. The trend of decline in absolute values is particularly troubling and indicative of systemic societal, economic, and medical care issues. The average of the cohort was almost 3.4 years higher in 2017, an increase from the value of 2.2 years higher in the year 2000. The trends in public health in the United States are not good, especially considering this study data included only data through 2017. The recent bungled response to COVID will accelerate the decline relative to the cohort, which is representative of other developed nations.
Certain questions arise from this investigation:
1 Comment
J Lee
11/16/2020 03:51:16 am
Two thumbs up, Mike! Leave a Reply. |
InvestigatorMichael Donnelly investigates societal concerns with an untribal approach - to limit the discussion to the facts derived from primary sources so the reader can make more informed decisions. Archives
July 2023
Categories |
 RSS Feed