Celebrate the Facts!
|
|
|
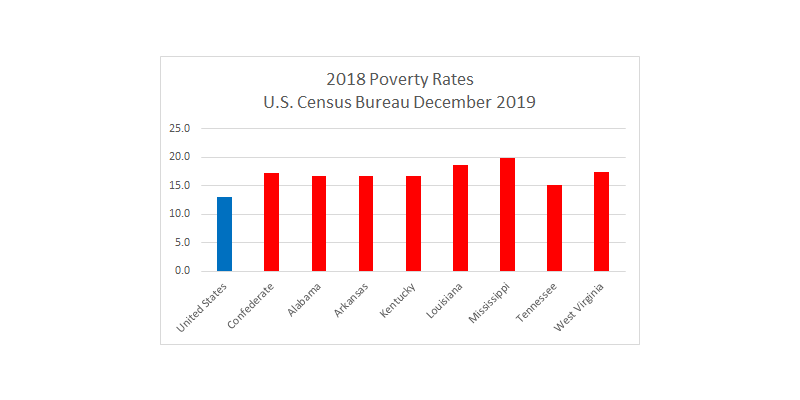
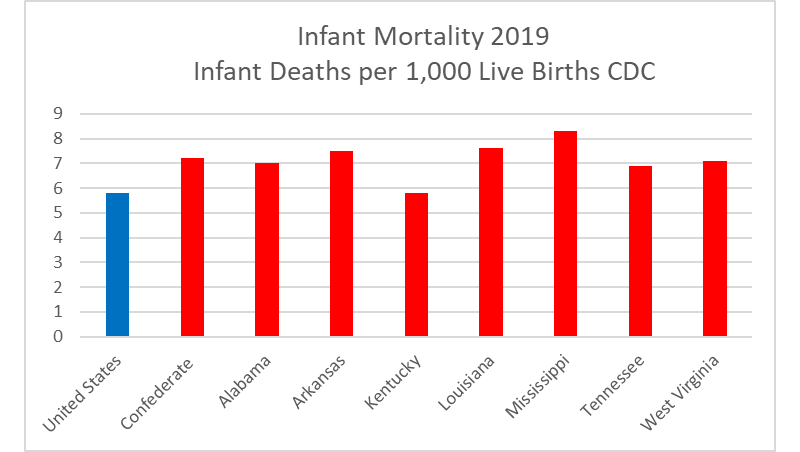
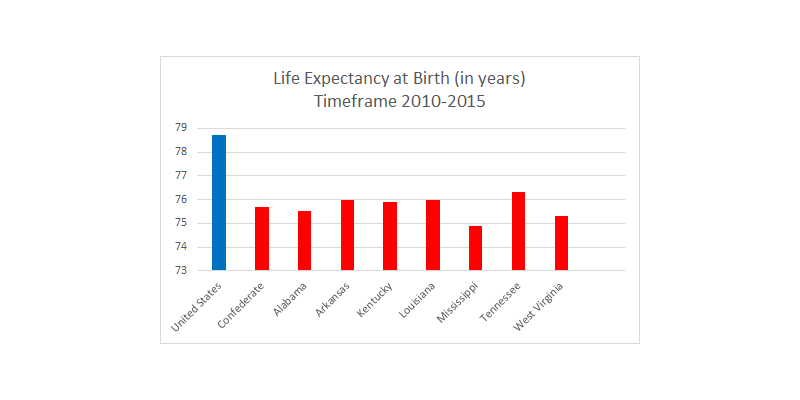
10/18/2020 2 Comments The Confederate States of MiseryThere is a nation within the United States – The Confederate States of Misery – consisting of seven states in the south-central part of the country: Alabama, Arkansas, Kentucky, Louisiana, Mississippi, Tennessee, and West Virginia. These states all share a common cultural identity and all follow an anti-democratic system of governance. The anti-democratic governments in these states have missed a big fact: repressing diversity, suppressing women’s reproductive rights, suppressing organized labor, legislating regressive tax policies, and encouraging segregation and racial prejudice throttle economic growth for all and result in the economic stagnation that is The Confederate States of Misery. 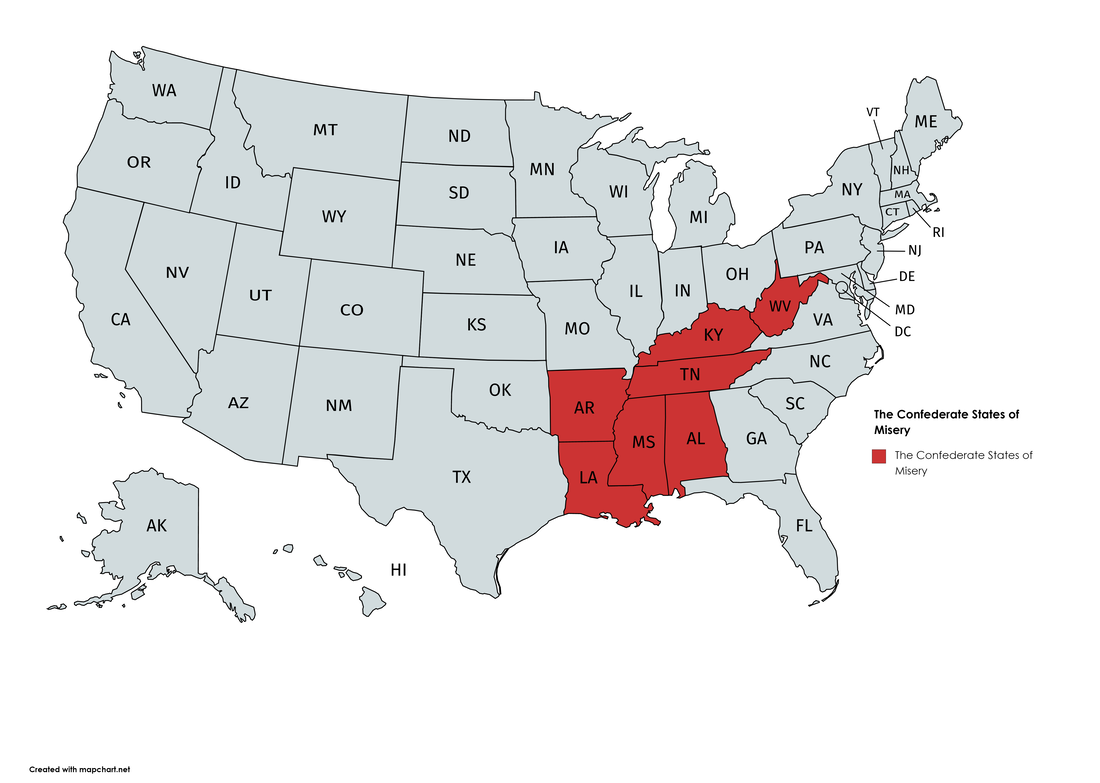 The Confederate States of Misery Five of these states were members of the Confederate States of America. West Virginia was partitioned from Virginia during the Civil War as a Union state. Kentucky was a neutral slave state occupied by Union troops. The cultural, economic, and governmental characteristics of these states tie them together in the Confederate States of Misery – a failed autocratic alliance of governance that does not serve its population. There are no apparent geographic causes of grinding poverty in the Confederate States of Misery; all these states have substantial natural assets and resemble the United States as a whole. Many areas of these states feature beautiful topography and would otherwise be attractive for tourism and related development. The cause of the economic stagnation is poor governance based on archaic cultural dispositions including racial bias, and that is what separates them from prosperity. After the end of Apartheid in South Africa, GDP growth rose to nearly 3% from 1.25% during 1980–94. The stagnant economic conditions in the Confederate States of Misery appear very similar to what occurred in South Africa during Apartheid and the end to such is the first step towards progress for all. 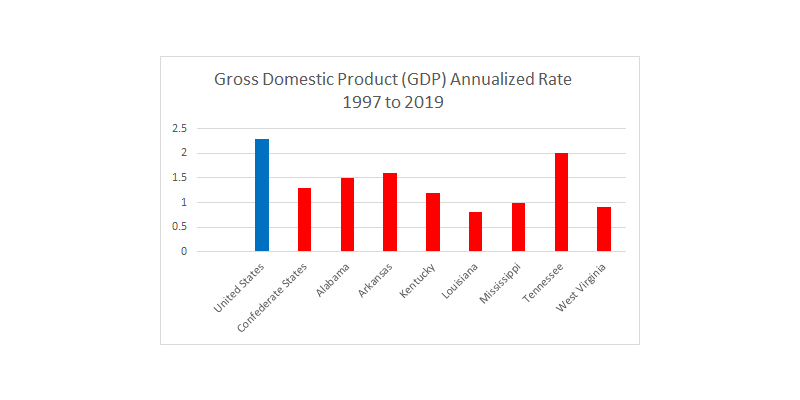 Comparison of GDP Growth Comparison of GDP Growth Correlation is not causation is the mantra of data analysis but numbers do inform and perhaps an examination of the facts can help open a dialogue between ideologically opposed political groups. The Confederate States of Misery from 1997 to 2019 had a GDP growth of 1.3% annually, almost identical to the South Africa Apartheid value, compared to the United States rate of 2.3%, so they are falling farther behind the rest of the United States every year. This ideologically aligned group of repressive governments has empirically failed in the most important indicator of economic prosperity and in its duty to protect and help its citizens, but there is much more evidence for the thesis of this investigation. Trailing is a snapshot of indicators of the human cost of that failed governance:
The facts on the governance:
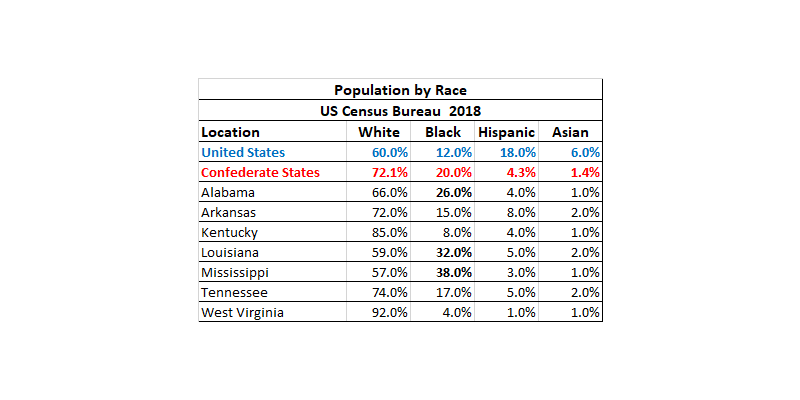 Population by Race (American Indian and Two or More Races <1%) The racial composition of these states is particularly interesting. The Confederate States of Misery include 20% African Americans compared to the United States value of 12% and that population is much higher in Alabama (26%), Louisiana (32%), and Mississippi (38%), all states with historic severe voting rights suppression. The Hispanic population in the United States is 18% compared to 4.3% in the Confederate States of Misery likely due to historic poor economic opportunities due to distressed wages and historical racism but empirical consideration is outside the scope of this examination. Asian populations are also negligible compared to the United States rate of 6%, perhaps also indicative of avoidance of residence due to hostile environments. Republicans have deepened their hold on Southern state legislatures and gerrymandered House districts to minimize the ability of Democrats to make inroads in Congress. Various metrics are used to evaluate underrepresentation but they all essentially boil down to the same concept – taking the percentage of Democratic voters in the state and comparing that to the number of seats in the House in that state to provide an objective determination of the effect of gerrymandering. The Confederacy States of Misery uses gerrymandering to maintain a firm hold on power by white conservative Republican males. Gerrymandering has been a topic of public debate since the birth of the United States and court decisions have ebbed and flowed depending on the political makeup of the federal bench and the Supreme Court. The recent sharp conservative turn of the federal judiciary as a whole and the Supreme Court does not bode well for future efforts to restrict gerrymandering and so free up opportunities for progressive representatives. The future of the Confederate States of Misery appears bleak. Opportunities for progressive and diverse candidates seem out of reach and finding an end to Apartheid and repression of the poor in general appears hopeless. A generational approach to gaining state legislative seats and fostering good governance at the state level would help not only in the welfare of the state but also gaining federal representation that in some way resembles the demographics of the states. The national Democratic Party needs to focus and fund more than just presidential election campaigns to accomplish meaningful change and make that commitment long-term. Alas, the Democratic Party appears lost in tangential cultural debates and frivolous ideological disputes with its counterpart and seems to have written this area off as hopeless. A focus on pragmatic economic issues at the national level would help but the two parties appear gridlocked on ideological tribal discussions that generate emotions but few results. It is odd the two parties can agree on incredible defense expenditures to defend against non-existent military challenges but not understand poverty and hopelessness is an existential threat to the United States. Past measures to improve poverty have been effective and the investment itself, while not only being moral and ethical, likely would pay back over time by improved GDP growth alone, but that is a subject of another investigation. GDP data is available at https://apps.bea.gov/iTable/index_regional.cfm. Data on GDP growth in South Africa is found at https://www.imf.org/external/pubs/nft/2006/soafrica/eng/pasoafr/sach2.pdf. Poverty rates are provided at https://www.census.gov/data/datasets/2018/demo/saipe/2018-state-and-county.html. Rates of child poverty are presented at https://data.ers.usda.gov/reports.aspx?ID=17826. Life expectancy at birth data can be found at https://www.kff.org/other/state-indicator/life-expectancy. Flat income tax data is located at https://www.thebalance.com/state-income-tax-rates-3193320. Unionization by state information is presented at https://www.bls.gov/news.release/union2.t05.htm. The unionization rate for the United States is available at https://www.bls.gov/news.release/pdf/union2.pdf. Voter requirements can be referenced at https://www.theguardian.com/us-news/ng-interactive/2019/nov/07/which-us-states-hardest-vote-supression-election. Minimum wage information was obtained at https://www.ncsl.org/research/labor-and-employment/state-minimum-wage-chart.aspx. Data on federal representation can be reviewed at https://projects.propublica.org/represent/states. A good summary of reproductive rights status can be found at https://www.usatoday.com/in-depth/news/nation/2019/05/15/abortion-law-map-interactive-roe-v-wade-heartbeat-bills-pro-life-pro-choice-alabama-ohio-georgia/3678225002/.
2 Comments
Neal Copeland
10/18/2020 02:56:25 pm
Great read. Valuable insight.
J Lee
10/18/2020 03:35:55 pm
Enjoyed as usual!! Leave a Reply. |
InvestigatorMichael Donnelly investigates societal concerns with an untribal approach - to limit the discussion to the facts derived from primary sources so the reader can make more informed decisions. Archives
July 2023
Categories |
 RSS Feed